Model types
CodeDig! and Code Digs
A Code Dig is an analysis of a codebase. It could be relatively new or decades-old legacy.
The Domo CodeDig!™ software reads the source on your computer and writes an encrypted .domo file. You import
that file into a DomoModeler product's domain. From that file, DomoModeler projects models that you
choose to view and even modify. The modeler also derives two types reports based on the analysis.
Note: The tool you use to crawl a codebase and write the analysis file for import is the Domo CodeDig!™ command line interface (CLI). The resulting analysis is called a Code Dig. In the documentation we refer to the tool as CodeDig! (one word) and the results a Code Dig (two words).
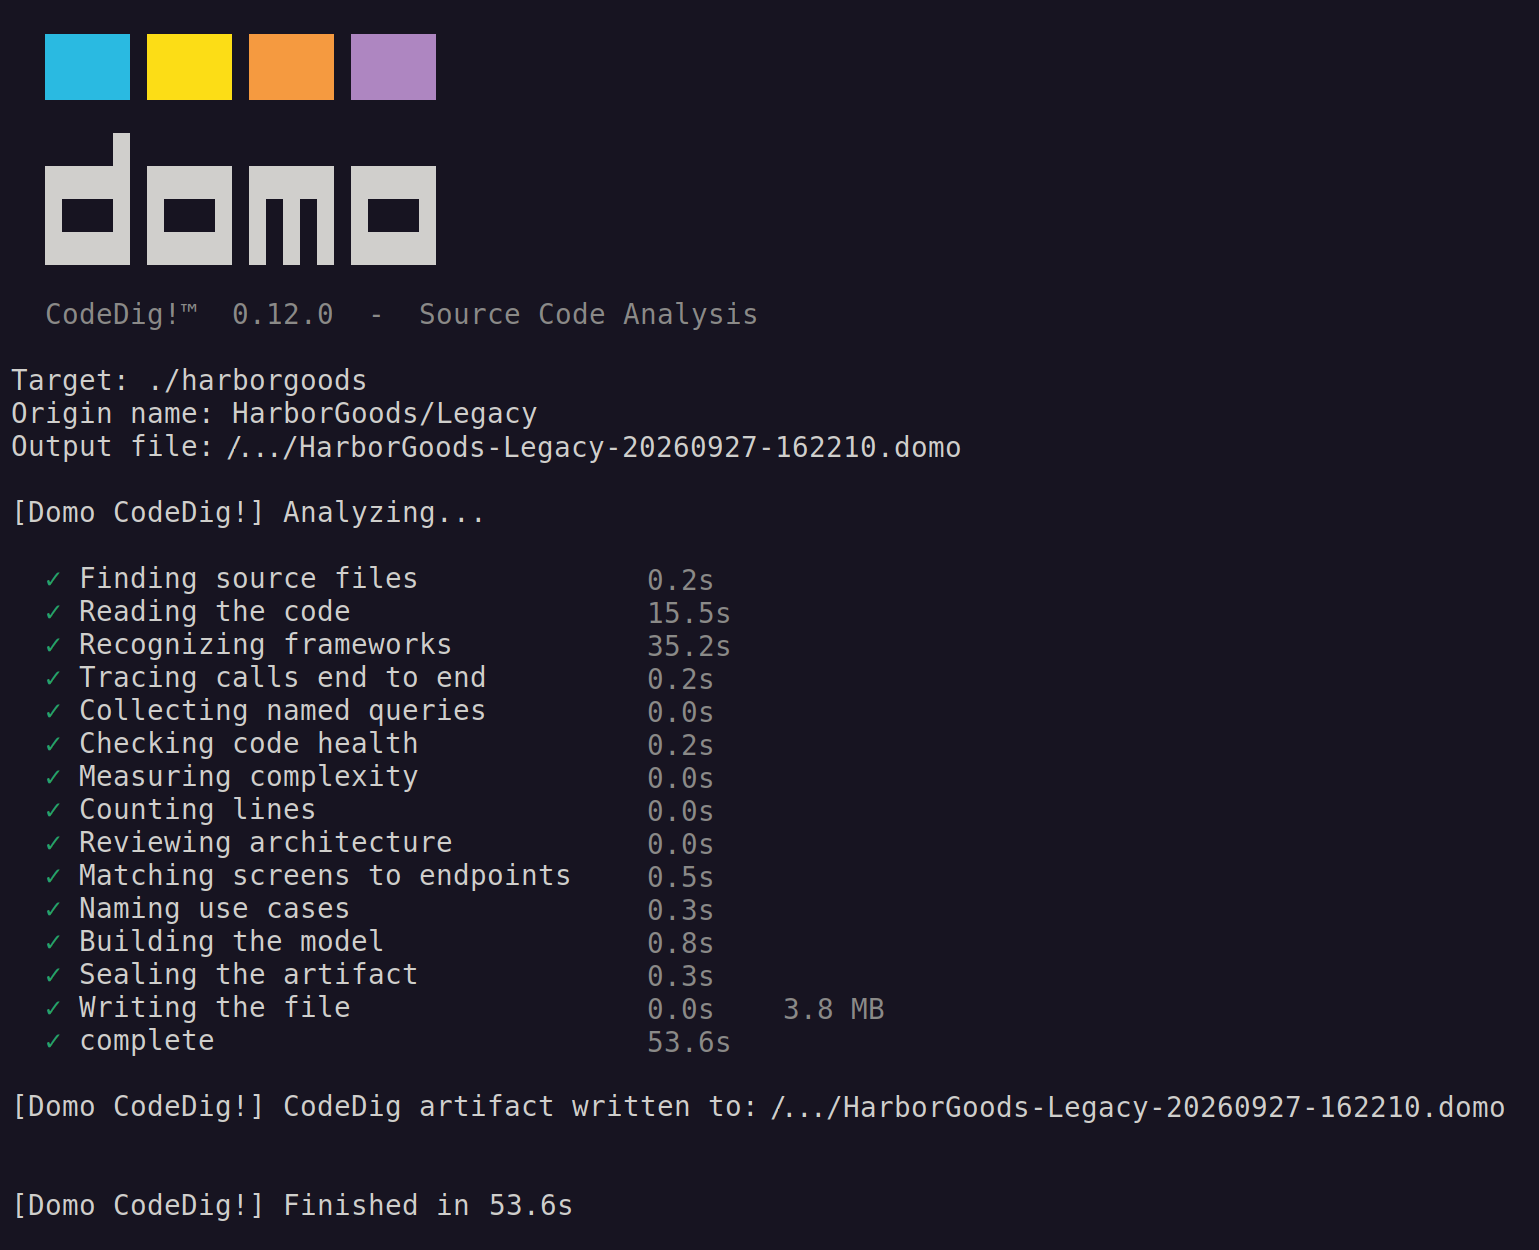
Domo CodeDig!™ does not use a coding agent (i.e. LLM) and is 100% deterministic. If you run the same version of the CLI on the exact same codebase multiple times, it will produce the exact same analysis every time. Although the resulting analysis of a highly tangled complex codebase won't be perfect, there are never hallucinations about what can be accurately determined. The tool actively avoids guesses and openly records when its confidence level is high, medium, and low.
A Code Dig is the one model type that you do not create from scratch. There is no Code Dig editor, and that is deliberate. A Code Dig is a deterministic analysis record of what CodeDig! has found in an application's or system's existing source code and is persisted in a unique Code Dig file.
A Code Dig and the models projected from it, as well as the derived reports, are a means to understand an existing application or system. The reviews are generally useful for transformation and modernization efforts. The existing codebase is commonly one belonging to a legacy Big Ball of Mud. Still, there may be many reasons to examine a codebase by means of a Code Dig analysis. Perhaps your goal is to learn more about and better understand a codebase you are actively working in.
Note: The projected models are not a huge UML static structure (e.g. class) diagram that renders as a vast web of boxes and lines. Our aim is to show you the existing use cases and user stories over a time series of behavioral interactions. And, no, that's not done with UML sequences diagrams. DomoModeler offers four different model projections: EventStorming, Flow, Hexagonal / Ports and Adapters, and C4. Further, the two report types are: named use cases and user stories with components, and a deep analysis of test coverage and code complexity.
Which codebases can be analyzed? CodeDig! reads Java/JVM and .NET codebases, along with React, Angular, Vue and Svelte front ends on either. See Supported platforms at the end of this chapter for the frameworks and libraries recognized on each and, just as importantly, what is not supported.
Installing CodeDig!
CodeDig! is a Pro feature. Both the download and the token live under Account → Tools.
Download the CLI. Account → Tools → download
domo-codedig-0.9.0.tgz.Install it globally with npm:
npm install -g ./domo-codedig-0.9.0.tgzThat puts a
domo-codedigcommand on your path. Node.js is the only prerequisite.Create a token on the same tab. It is shown once and only once. DomoModeler stores only a hash of the token and cannot show it to you again. A lost token must be revoked and replaced. It cannot be recovered.
Analyzing a codebase
Running the CLI with no arguments is safest. This is the form to use, and the only one that keeps your token out of sight:
domo-codedig
It asks for what it needs, one at a time:
Domo User Token:          (not echoed)
Source Code Directory:
Origin Name:
The token prompt does not echo and nothing is written anywhere it can be read back.
Important: --token is supported, but you should usually avoid it. A token on the command line is generally
recorded in your shell's history and is visible in the process list to anyone else on the machine. For example,
if you are using bash, the full command stays in ~/.bash_history long after you have forgotten it is there.
Of course, there are ways to prevent secrets from being persisted in history, but they can still be seen on the
command line:
domo-codedig ./my-project --token d1c3d2a_54n --origin-name acme/payroll # token leaked twice
Note: The above
d1c3d2a_54nexample token is weak and not one generated for you by the DomoModeler. It only represents a real token.
Anything you do pass is not requested by a prompt. The directory path and origin name are safe to give on the command line. Only the token is worth withholding:
domo-codedig ./my-project --origin-name acme/payroll
Domo User Token:          (not echoed)
The analyze keyword is optional because currently analyze is the only command. Thus, domo-codedig analyze ./my-project …
means the same thing.
But what about a CI?
A non-interactive run is never prompted; it says what it needs and stops. So CI has to supply the token along with all CLI arguments. The token should be given through a secret environment variable rather than a flag:
DOMOMODELER_TOKEN=$DOMO_SECRET_TOKEN domo-codedig ./my-project --origin-name acme/payroll
Set DOMO_SECRET_TOKEN as a masked secret in your CI system. For example, GitHub Actions secrets,
GitLab masked variables, Jenkins credentials all redact secrets from logs. An environment variable does
not appear in the process list the way a non-secret option does.
Caution: Use a token created for CI, not your own personal token. It can be revoked when a pipeline is retired or a build log leaks, without disturbing anyone's local work. The audit trail then indicates which one was used.
Where the file goes
There's one artifact file that is saved to the current directory. For example:
acme-payroll-20260827-142317.domo
The file is named from the origin name, so the file says what the import will do with it. A timestamp is appended to the normalized origin name, which prevents two analyses from overwriting each other. Run the command from wherever you want the file to be written.
As stated, the origin name is normalized first. That's because what often serves as a good origin name would
not form a valid filename. The following characters are replaced: /, \, :, *, ?, ", <, >, |
and all whitespace become -.
Any direct uses of - are collapsed, while leading and trailing - and . are trimmed. The result is capped
at 100 characters, which leave room for the timestamp and extension. For example, acme/payroll is written as acme-payroll.
Note: Only the filename is normalized. The origin name DomoModeler matches on is the one you entered and it is stored exactly as given. That is,
acme/payrollstaysacme/payrollin the file and is imported into DomoModeler as well. Two origins that differ only in punctuation remain two separate Code Digs even though the respective files could be named alike.
There is no output switch, and nothing human-readable is produced. The artifact is encrypted to DomoModeler and cannot be read back on your machine. DomoModeler owns the presentations, which is why the reports and projections live there rather than in the CLI.
Importing a Code Dig
In the dashboard, use the import button on a Domain's Code Digs compartment and choose the .domo file.
Limitation: Since the
.domoCode Dig files are compressed, they can decompress into many times the file size. Therefore, the file size can currently be no larger than 12 MB. The 12 MB could potentially decompress to 10 times or greater. Any greater size could place extreme pressure on the DomoModeler resources and could even cause failure during import. Still, even very large codebases with many thousands or components can be packed into a 4 MB to 8 MB file, usually making 12 MB a high ceiling.
Once imported, there are several options for projecting models and viewing reports.
The origin name is important
--origin-name is the name you choose for the codebase, and DomoModeler uses it to decide whether an
analysis is a new Code Dig or a newer version of one you already have. It is not derived from a repository
URL, because that breaks on monorepos, on code handed over as a tarball with no version control at all, and
on the several spellings of one Git remote.
Two rules follow from that:
- Keep it stable. The same codebase should carry the same origin name every time, or each analysis creates a separate Code Dig.
- Keep it distinct. Two different codebases sharing one origin name is the one case DomoModeler cannot sort out for you, because both files say the same thing. It will ask rather than guess; see When an import asks a question.
The name you gave is what the Code Dig is called at first. Rename it afterwards if you like; renaming does not break future imports, because the origin name is stored separately from the display name.
What a Code Dig produces
From the dashboard, click a Code Dig to open its dialog. Everything that can be created from it is listed here in the dialog.
Projections are the models you work in
DomoModeler projects a Code Dig into one or more models that you choose from its dialog.
| Projection | Built from |
|---|---|
| EventStorming | Commands and queries from the operations found; includes UI, entity, and other element types as needed |
| Flow Architecture | In use case flows, each separated by a swimlane, show: UI, endpoints, controllers, services, entities, data access |
| Domain Model | The entities and other models types found and the associations between them, with appropriate multiplicity |
| C4 Architecture | Build artifacts as containers, packages as components, with declared dependencies |
Each dashboard item reads Create the first time and Update afterwards, naming the model it would update.
Reports are documents that you read
DomoModeler also creates reports from a Code Dig. Again, use the dashboard's Code Dig dialog: under Reports, the single View button opens the reports page at its first tab. Each report is a tab of that page, and the dialog lists them in the tabs' order:
Use Cases: Offers a catalog with its confidence tiers, the review queue, user stories and the traceability matrix. Copy as Markdown gives you the same content in a form you can diff, grep, paste into a pull request or commit beside the code.
Architectural Quality: The architectural patterns found in each unit of the codebase, with their severity.
Code Reference: Every type and method the analysis read, browsable by module and by letter.
Code Health: Issues grouped by category, such as dead code, long methods and god classes. Each category card opens that category's list.
Cyclomatic Complexity: Complexity and maintainability for every scored file, with the most complex files, the files needing attention, and each file's methods, plus line counts. Test code is hidden unless you choose Include test code. Each card that names a list opens it.
Coupling: Integration strength by distance, in the terms of Vlad Khononov's Balancing Coupling in Software Design: intrusive, functional, model and contract coupling, counted from within one module out to across artifacts. Beside the grid are the evidence found, how many calls the analysis could resolve (only resolved calls are classified, so every count is a lower bound), and CodeDig!'s limitations. The first of those matters most: functional coupling is detected on a best-effort basis, so a missing functional connection is never proof that two parts are independent. Whether a connection is balanced also depends on volatility, which comes from your Subdomains and is not judged here yet. Analyses made before CodeDig! reported coupling show this tab as Not run.
Every count opens the cases behind it. Select a number in the grid, a piece of evidence, or the shared tables or transactions, and that list of cases opens below the summary. Cases run from worst to less concerning: the strongest integration across the greatest distance first, then by weight (call sites or shared resources). They show 50 at a time with Show 50 more. Each case names both types with their module and source file; open either line to see that type's Code Reference entry in place. Test code is hidden unless you choose Include test code.
The Architectural Quality, Code Health, Cyclomatic Complexity and Coupling tabs each open with a summary of what the analysis reached, because that qualifies every number on them.
Note: The confidence tiers indicate how confident DomoModeler is about the name of contents of a given use case. Often there is high confidence, but in some cases the names of existing source code is tricky and confusing to understand. Such low-confidence results might be cleared up by human review.
Reports are always current: they are read from the analysis each time you open them, so there is nothing to regenerate. Re-importing is what refreshes them.
Note: Often a legacy system undergoes continuous development (patches, bug fixes, and enhancements). As the codebase changes, you might want to generate a new analysis using the CLI and re-import it. Doing so will cause the reports to be refreshed.
Reading a projected model and report
Review this section before drawing conclusions about your codebase.
Some models will indicate a confidence level by background color. For example, if you see a Flow Architecture or EventStorming model with one or more swimlanes that have a dotted amber background, that indicates a low-confidence use case. All other use cases have a normal grid or white background (depending on your user preferences).
Some of the projections to models that you see may look like the tool failed:
- a model's element sequences/flow are thinner than you expected
- an EventStorming model with no events
- a report section with no numbers
- a use case report marked low confidence
Usually any of those are the result of the analysis refusing to guess. Often, code states some things plainly and leaves others unsaid, which is especially common in legacy code (e.g. a Big Ball of Mud). When a projection is silent in places that you expect answers, DomoModeler displays the "silence" rather than producing something about what is truly unknown. In other words, the analysis and projected models are based on explicit components, not ones that might be implied. For example, if there are no explicitly defined events found in a code base, none of the CodeDig! or DomoModeler artifacts will imply that they could potentially exist—not any analysis, model projection, or report.
Yet, your team can extend from an "as-built" model to one that is "to-be" by inserting elements at key locations.
Not run vs. Nothing found
From the DomoModeler perspective, the reports have a separate section for each thing CodeDig! measures: code health, complexity, line counts, architectural quality, and use cases. Each kind of analysis is reported on its own.
A section marked Not run means that measurement was never taken while your analysis was being produced by the CodeDig! CLI. It reflects nothing at all about the state of your code. That is, your code might exhibit a form that would be detected by a later release of the CLI that produces a result of which DomoModeler is aware and knows how to deal with, but you didn't use that newer version of the CodeDig! CLI. So, the imported analysis file was written with no such measurement records. The best way to deal with that is to download the latest release of the CLI from the DomoModeler dashboard's Tools section of your user Account, which is available from the upper right dropdown menu.
Nothing found is the opposite: the measurement was taken, DomoModeler scanned for it, and the outcome was empty. That's a result about your code, which would usually mean a "clean bill of health," and thus be considered good.
Why is this an important distinction? An analysis rendered as "0 issues" when it never ran would reflect a gap in the tool as a clean bill of health for your source code. That would instill a false level of confidence, and you would have no way to tell by the outcome. That's because a mistaken zero looks exactly like an earned one. Instead, the two are always shown distinctively.
Coverage says what the run did not reach
The report opens with what the analysis actually read: files seen, files parsed, languages analyzed, and the most important one: languages that contributed nothing.
A model asserts completeness in a way prose does not. If your repository is Java plus a large JSP layer and only the Java was parsed, every model here describes the Java half and looks complete. The coverage line is what tells you otherwise. Read "jsp contributed nothing" as "nothing written in JSP reached any model or metric on this page".
How calls are counted
The Coupling tab says how well the analysis read the codebase's calls, for example "At least 93% of calls to this codebase's own types were resolved. 28% of all calls go to libraries and frameworks, which are outside the analysis by design." CodeDig! sorts every call into one of four parts:
| Part | The call goes to | For coupling |
|---|---|---|
| Resolved | another type the codebase declares | the only calls classified |
| Unresolved | a receiver that no declaration identifies | may be coupling, so counts are a lower bound |
| The type itself | the type's own members or its base class, such as this.save() or base.Load() |
not coupling |
| Libraries and frameworks | a type the codebase does not have, such as String.Format() or Path.Combine() |
outside the analysis |
The percentage is resolved calls out of resolved plus unresolved, which leaves out the calls that are not coupling between your own types. It says at least because some unresolved calls also go to libraries, so the true rate is that figure or higher. Dividing by every call instead would read as poor analysis: on one Java codebase it gives 45%, when nearly a quarter of its calls are on the type itself and over a quarter go to libraries.
Every type CodeDig! assigns to a call comes from a declaration in the source: a field, a local variable, a
parameter, a method's declared return type in a chain such as loan.getAccount().getStatus(), an enum
constant, or a lambda parameter whose type a codebase method declares. It never guesses a type by elimination.
What to expect by language:
- Java resolves nearly everything. Typically 2% to 3% of calls stay unresolved.
- Modern C# leaves more unresolved, often 20% to 33%. Most of these are lambda parameters of library
methods (LINQ's
Where(x => ...), Entity Framework, AutoMapper), properties inherited from framework base classes (Response,ModelState), and chains on library results. Nearly all of them are probably library calls, but CodeDig! would have to read the library to know, so it reports them as unresolved rather than inferring. That is why a C# codebase can show a lower percentage without its own code being read any less carefully.
Analyses made before CodeDig! split calls this way show the older figure, resolved calls out of all calls.
An EventStorming with no events is expected
A Code Dig projection to a EventStorming model likely has commands and queries but no domain events. In such cases, the projection places a hotspot element where the events belong. This serves as a flag for you to follow up and purposely replace the hotspot with a modeled event, assuming you intend to transform to an event-driven model and architecture. If that's not in the cards, you can delete the hotspots.
When code does not state its events, a method/function that changes state will not assert which fact the business cares about. The analysis and projection guessing would fill your model with events that nobody decided to emit. What you do know is that commands trigger events, and from a command and business collaboration, your team can decide which events must be emitted and recorded.
A low-confidence use case is the signal, not a defect
Most use cases that score LOW have included reasons. A LOW score is the result of analyzing code, not a failure to try harder. Examine the source code for lack of explicitly expressing intent.
Each use case carries its own confidence, its own name confidence, and the reasons behind both. The review queue explains what kind of encounter caused doubt and what to check. A catalog of evenly-weighted rows would be a more confident document than the analysis behind it.
Nothing is promoted for you
The Domain Model projection makes every persistent type an Entity. None becomes an Aggregate, and no association becomes an aggregation or composition.
A foreign key tells you Order references OrderItem. It does not tell you that Order is a consistency
boundary somebody designed. Designing a consistency boundary is one of the most consequential decision in
a tactical design, and it is yours to make explicit in the model. The projection's job is to generate the entities
and their real associations in the as-built models so your team can determine the consistency boundaries.
Where the source states a multiplicity you will see it at each end of the line. DomoModeler uses the UML
syntax in this particular case, which places the appropriate cardinality on either side of the relationship.
One of the most common and safe is a one-to-many, which displays as 1 and *. Where no multiplicity is
indicated in a given relationship, the analysis and projection won't render any on the model.
Source details in Specifications
A projection makes element names (the visible text inside the element) as short as possible. That helps keep
a lane and entire model easy to review and simple to read. The detail of what the
analysis found goes into the element's properties instead. To open the Properties dialog, select the element and
press Enter, hover over the element and click properties icon, or open the element's context menu and select the
Properties… option (see Element properties).
The detail is in Specifications, under one or more bold headings that begin Code Dig:
| Heading | Where | What it holds |
|---|---|---|
| **Code Dig! | Source** | Domain Model elements |
| **Code Dig! | Declared methods** | Domain Model elements that declare methods |
| **Code Dig! | Addressability** | Flow screens (UI elements) that answer no URL |
The method list lives on the Domain Model rather than on Flow because a Flow repeats an element in every use case that passes through it. The same list would be stored once per lane, and a large model would carry many copies of the same text.
⚠️ Keep the Code Dig heading at the very top of the field. It is how Update tells the text it wrote from text a person wrote. When the field starts with a Code Dig heading, Update replaces the whole field with fresh details from the latest analysis. When it does not, the field is treated as yours and left alone.
That has three consequences:
- Anything you type into a field that still starts with the heading is replaced on the next Update, including notes added below the generated block.
- To keep your own notes, write them above the heading. The field is then yours: Update never changes it again, and its generated details can go out of date.
- Removing or rewording the heading has the same effect. To get fresh generated details back later, clear the field completely and select Update.
Re-importing and staying current
Re-analyze the codebase, import again with the same origin name, and the Code Dig updates in place.
⚠️ Nothing is ever deleted by a re-import. An analysis of one module refreshes what it covers and leaves everything else alone. Otherwise, analyzing part of a large codebase would silently wipe the rest. The import message tells you how many elements were added, matched, and kept.
Projections do not refresh automatically. Since a model projected from a Code Dig is what you work in, automatically overwriting it because someone ran a CLI would be an unwelcomed surprise. Rather, a projection built from an older analysis is marked Out of date in the dialog. Selecting Update re-projects it.
Updating merges new elements into the model rather than replacing existing ones. You'll be happy to know that your layout is kept, and anything you added by hand stays. Only what the analysis detects as different is refreshed.
The generated details in an element's Specifications follow their own rule; see Source details in Specifications.
When an import asks a question
Two situations need an answer only you can give. Both show a dialog with the numbers behind them.
"This may be a different codebase." The incoming analysis has almost nothing in common with the Code Dig it matched by origin name. This will occur when two different codebases have been given the same origin name. Choose Yes, merge if it really is the same system, or No, it's different to create a separate Code Dig. Nothing is written until you answer. Just beware that if you import a Code Dig from a different codebase over an existing Code Dig, the results will be
"Which Code Dig is this?" Two Code Digs in this domain already share the origin name, so the file cannot
be matched to one of them. Select the one to which it belongs. You'll want to re-run CodeDig! with a distinct
--origin-name, which is the only way to stop it recurring.
Required code elements
We only collect the minimal amount possible. We never upload your full source code. Analyzing a codebase does require importing some information about it. DomoModeler requires structure and identifiers only. The following is the list of what is collected in a Code Dig, and subsequently the list of what we don't use.
Code elements that are needed
| Kind | Included |
|---|---|
| Names | Classes, interfaces, enums, methods, packages and namespaces, and build artifacts (JAR, WAR, DLL) |
| Types in signatures | Return types and parameter types, by name |
| Database tables | Table names, where the code states one |
| Locations | File paths relative to the folder you analyzed, and line numbers |
| Structure | Which unit contains which, which calls which, which reaches a data store, which depends on which |
| Measurements | Complexity scores, line counts, comment density, code-health findings |
| Your label | The --origin-name you chose |
Code that's not collected
| Kind | Excluded |
|---|---|
| Any code you wrote | Method bodies, expressions, statements; no executable content of any kind |
| Literals | Strings, numbers, constants, configuration values |
| Comments | Including documentation comments |
| Secrets | Credentials, connection strings, API keys, environment values |
| Computer details | Absolute paths, user names, host names, directory layout above the analyzed folder |
Caution: Even a limited amount of codebase details can say too much to the wrong audience. A component named
ProcessPayrollBatchServletand a table namedSALARIED_EMPLOYEESmight disclose to some readers more about your internal business operations and/or the technologies in use than they should know. Our point? Treat a Code Dig as you would any internal architecture document and note that everything above is exactly what the models and reports are made of. There is no way to have the projections without the names.
What DomoModeler does with each analysis
We use what you upload only to store and render it for your ongoing use. We do not mine it, train on it, or build profiles from it. We never sell any of your data to third parties.
The artifact is encrypted before it leaves your machine and only DomoModeler holds the key that opens it. Deleting your account erases Code Digs and everything projected from them, like all other models. See the Privacy Policy for how this harmonizes with the rest of our software services.
Managing Code Digs
Each dashboard item has a menu with Edit, Duplicate, Export, Share and Delete, the same actions every model carries. Sharing and access work exactly as they do for any model; see Sharing and access.
Deleting a Code Dig does not delete the models projected from it. Those are ordinary models and stay where they are. Rather, the models projected from a Code Dig can no longer be refreshed from ongoing updates for that specific Code Dig of origin.
Supported platforms
CodeDig! currently analyzes two platforms: Java/JVM and .NET. Coverage is not identical between them, and the difference is in how many frameworks and libraries are recognized. Both languages are parsed to a full syntax tree, and both yield endpoints, controllers, entities, persistence, and use cases, among other common source code and framework artifacts.
Note: This list describes what CodeDig! actually reads, not what it intends to read. If a technology is not listed here, the analysis does not recognize it. That does not mean the codebase is skipped. See What happens to an unrecognized framework below.
Java and the JVM
| Area | Recognized |
|---|---|
| Language | Java, parsed to a full syntax tree: classes, interfaces, methods, fields, annotations, calls, inheritance |
| Web frameworks → endpoints | Spring MVC and Spring Boot (annotations and the older XML configuration), Java EE servlets and EJB, JAX-RS, Struts 1, Struts 2, JSF |
| Persistence → domain model | JPA annotations, JPA orm.xml, Hibernate .hbm.xml, named queries in all three dialects, plain JDBC |
| Transactions | @Transactional on classes and methods, plus JDBC and JPA boundaries |
| User interface | JSP and JSPF, plain HTML, JSF/XHTML/Facelets including PrimeFaces |
| Build | Maven pom.xml → modules and the dependencies their authors declared |
Struts and JSP are listed deliberately. Recognizing configuration that predates annotations is what lets a genuinely old application be analyzed rather than merely counted.
Known gap: addresses written on Struts and JSTL tag elements (
<html:link>,<html:form>,<c:url>) are not read yet. Those screens still appear in the analysis; they simply carry no address, and the coverage figures report it rather than hiding it.
.NET
| Area | Recognized |
|---|---|
| Language | C#, parsed to a full syntax tree: types, members, attributes, calls, partial classes, generics |
| Web frameworks → endpoints | ASP.NET Core MVC and Web API, classic ASP.NET MVC, Web Forms (.aspx/.ascx), WCF, ASMX |
| Persistence → domain model | Entity Framework 6 and EF Core (including fluent configuration), NHibernate, Fluent NHibernate, data annotations, and classic ADO.NET |
| Transactions | TransactionScope, IDbTransaction, BeginTransaction |
| Dependency injection → call graph | Microsoft.Extensions.DependencyInjection, StructureMap, Autofac, Ninject, Unity, Castle Windsor |
| Validation and mapping | FluentValidation rules, AutoMapper and Mapster configurations |
| User interface | Razor .cshtml views, Web Forms markup and its code-behind |
| Build | MSBuild .csproj → projects and their declared references |
Two entries are worth attention. Registered dependency-injection types are what let a call through an interface be resolved to the class that implements it. And where a codebase has no ORM at all, the raw SQL is the mapping; that is, table names are read out of the query text and become entities.
Note: VB.NET and VB6 are not supported. Good language support is unavailable, so a VisualBasic codebase is discovered and counted but not read. In other words, the coverage figures in rather being ignored.
Front ends on either platform
React, Angular, Vue and Svelte are read the same way regardless of which backend serves them: components, and the HTTP calls they make, which are then correlated to endpoints on the Java or .NET side.
Analysis that applies to every language
The cyclomatic complexity and line counts per method/function and file are analyzed. In addition, analysis includes typical code smells and qualities:
- Use case synthesis that correlates invocation chains with purpose, and can be reviewed as user stories
- Code health such as circular dependencies
- Large classes such as the so-called "god-classes"
- Dead code that is no longer and possibly never was used
- Architectural quality such as layering violations and misplaced business logic
The use case support is key to the value of the analysis. It involves:
- Matching invocations chains among user interface components, endpoints and controllers, services, domain model (anemic or otherwise), and transactions with persistence
- Scoring each use case with a confidence level and providing a reason when the confidence is not high
Of course, the analysis data would be useless unless there is a way to view and inspect it, and from different perspectives. Specifically, use cases can be projected to DomoModeler's EventStorming and Flow Architecture models. Further, reports are generated that describe use cases and user stories associated with a codebase as well as for source code complexity and other code health reviews.
What is not supported
Stated plainly, because a gap you discover for yourself is worse than one you were told about.
| What | Why |
|---|---|
| Ruby, Python, PHP, Go, Node back ends | No recognizer. Files are discovered and counted, and the coverage figures say so. |
| VB.NET and VB6 | It might matter, but we aren't certain. |
| MediatR | Measured across nine .NET codebases and found almost exclusively in test mocks |
| Reflection by naming convention | Measured, and the rule overreaches roughly two to one. CodeDig! will not record a relationship it cannot stand behind |
| Mock setups treated as calls | A Setup and Verify are not supported |
Note: TypeScript and JavaScript with Node.js will likely be the languages and platform that we will next support.
What we don't know that we don't know
With the languages and technologies that we support, we've made our best effort to research and include the most popular frameworks and libraries for the respective platforms. Still, it's inevitable that some of the many lesser-known that are available won't be supported, but it that doesn't mean that those can't and won't be. If that's the case, let us know.
Note: Please feel free to contact us with any gaps that, if filled, could assist with your efforts.
There is a middle ground, however. Many components (interfaces, classes, and otherwise) will be
included in Code Dig analyses as the general model element type known as Type. It's used the
acknowledge a role played in a codebase without understanding precisely what the type means. This
will serve as a stopgap and make a given component visible.
What happens to an unrecognized framework
A codebase built on a Java or .NET framework CodeDig! does not recognize is still analyzed. Its classes, methods, complexity, health and architecture are all read normally. What it does not produce is endpoints from that framework. Because use cases are built from endpoints, fewer use cases follow.
That is the trade CodeDig! makes everywhere: report less, and report it accurately.